Free Dye snapshots library
The snapshots libary method also defines the likely dye conformations from a set of preliminary molecular dynamics simulations. But, unlike the Rotomer library method, this time the entire dye trajectory is used to define the possible dye conforamtions rather than representing them by a limited set of rotomers. This approach is more computionally demanding, and yields a much larger library of dye conformations, but the results are the most accurate of the three methods presented here. A single run to calculate the FRET efficiency, distance and orientation distributions with 1 CPU usually takes about 20h, but the code can be parallelized in very simple way using python's multiprocessing package
How to use?
- All scripts can be download here. You need also to install catdcd and some pythons libraries: numpy, matplotlib, and MDAnalysis.
The FD snapshot library is nothing else that dcd file obtained during the preliminary MD simulations of free dyes in water box. Here we provide such libraries for several fluorescent dyes (without water!) with consistent pdb files:
- AlexaFluor 488 (maleimide derivative attached to the CYS residue) dcd, pdb
- AlexaFluor 594 (maleimide derivative attached to the CYS residue) dcd, pdb
- AlexaFluor 594 (succinimide ester attached to the GLY residue) dcd, pdb
- Cyanine Cy3 (maleimide derivative attached to the CYS residue) dcd, pdb
- Cyanine Cy5 (maleimide derivative attached to the CYS residue) dcd, pdb
FRET Analysis
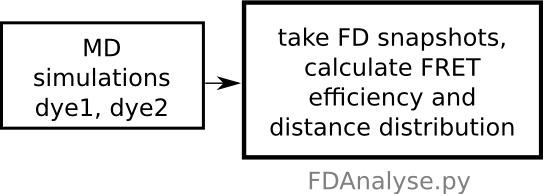
- Once the macromolecular system is chosen and the snapshot libraries for donor and acceptor are prepared,
the analysis
script FDAnalyse.py should be
run to calculate the distance, orientation
and FRET efficiency distribution for the
pair of dyes on the macromolecule. The
analysis script is divided into several
blocks which can be run
seperately.
- Before running the script, first change parameters inside it describing the names of the FD library files, the number of atoms in each dye, the R0 value, average atom size (for overlaping condition) and proper selections for atoms in system (to run selected blocks, just set the value of their indicator from 0 to 1).
- Run by typing:
python FDAnalyse.py
It will produce the output file, for example histogram_FD.dat, which contain the histograms of the distance and FRET efficiency distribution.
- The raw output assumes each photon is detected separately. In reality, most experimental data is the average of multiple photons. To see how this changes the histograms you can run the script BurstAvg.py by setting the number of photons to average in each burst at the top of the script and running:
python BurstAvg.py