Examples
The following are a few examples of how ExiFRET can be applied in different experimental situations. These cases demonstrate how the program can be used to study the effect of different parameters on the FRET efficiency and hence aid in the analysis and interpretation of data from FRET experiments . In addition to the examples below the program can also be used to investigate the effect of other experimental parameters on FRET efficiency. Examples include donor:acceptor ratio, laser power, type of fluorophore pairs (changes of R0), surface density of fluorophores in a membrane (2D). ExiFRET can also be used to distinguish between intra and inter-molecular FRET in cases where FRET occurring between fluorophores attached to separate hosts interferes with intra-molecular measurements.
Individual Fluorophores in solution
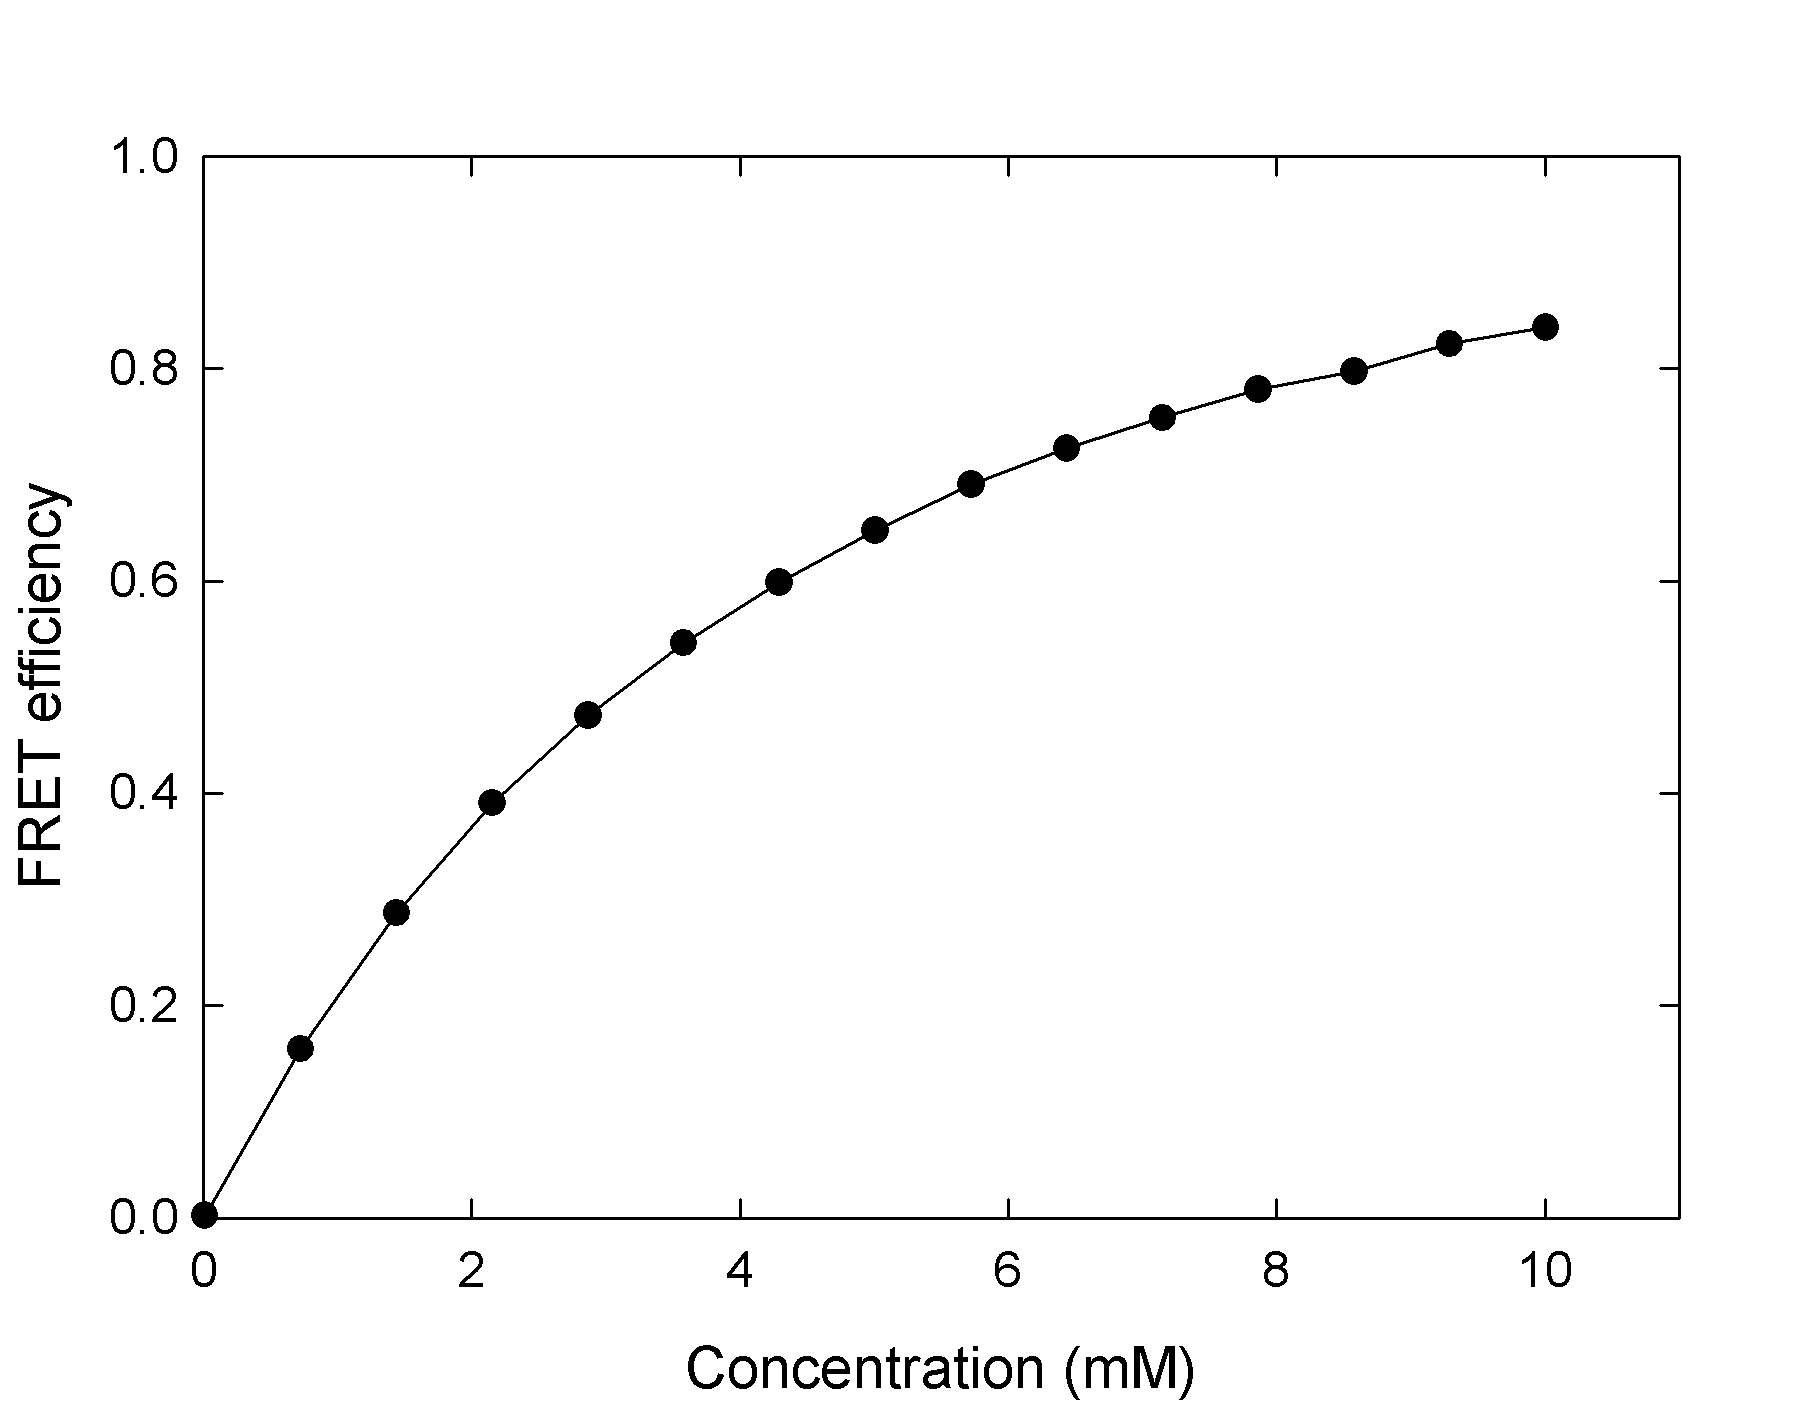
In the simplest case, individual fluorophores are randomly arranged in 3D. A practical example that corresponds to that case is when the fluorophores are attached to a host that is dissolved in solution. ExiFRET can be used to calculate the FRET efficiency for a series of concentrations to plot FRET efficiency as a function of fluorophore concentration. A sample input file to produce the data for the following plot can be found here
Clusters of fluorophores
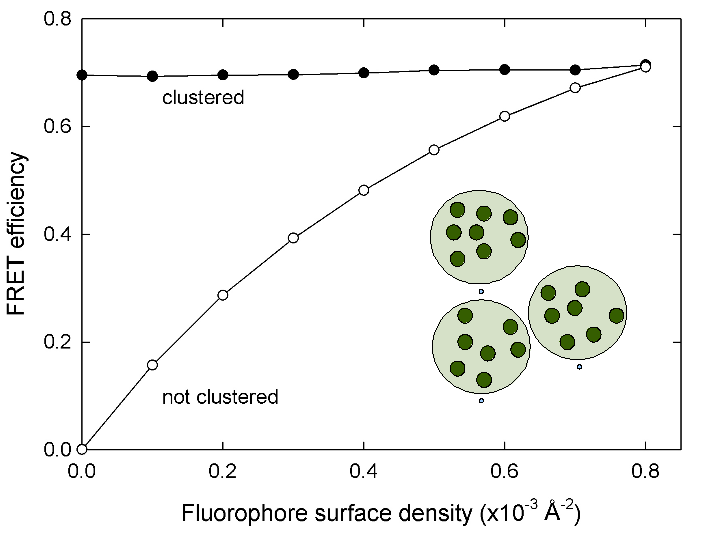
Clustering within a membrane can be detected by the lack of change of FRET efficiency with increasing surface density. The clusters are modeled as local regions with high density. The clusters themselves as well as the fluorophores inside the cluster are randomly distributed.
A sample input file to produce the data for the following plot can be found here
Size of a multimeric protein
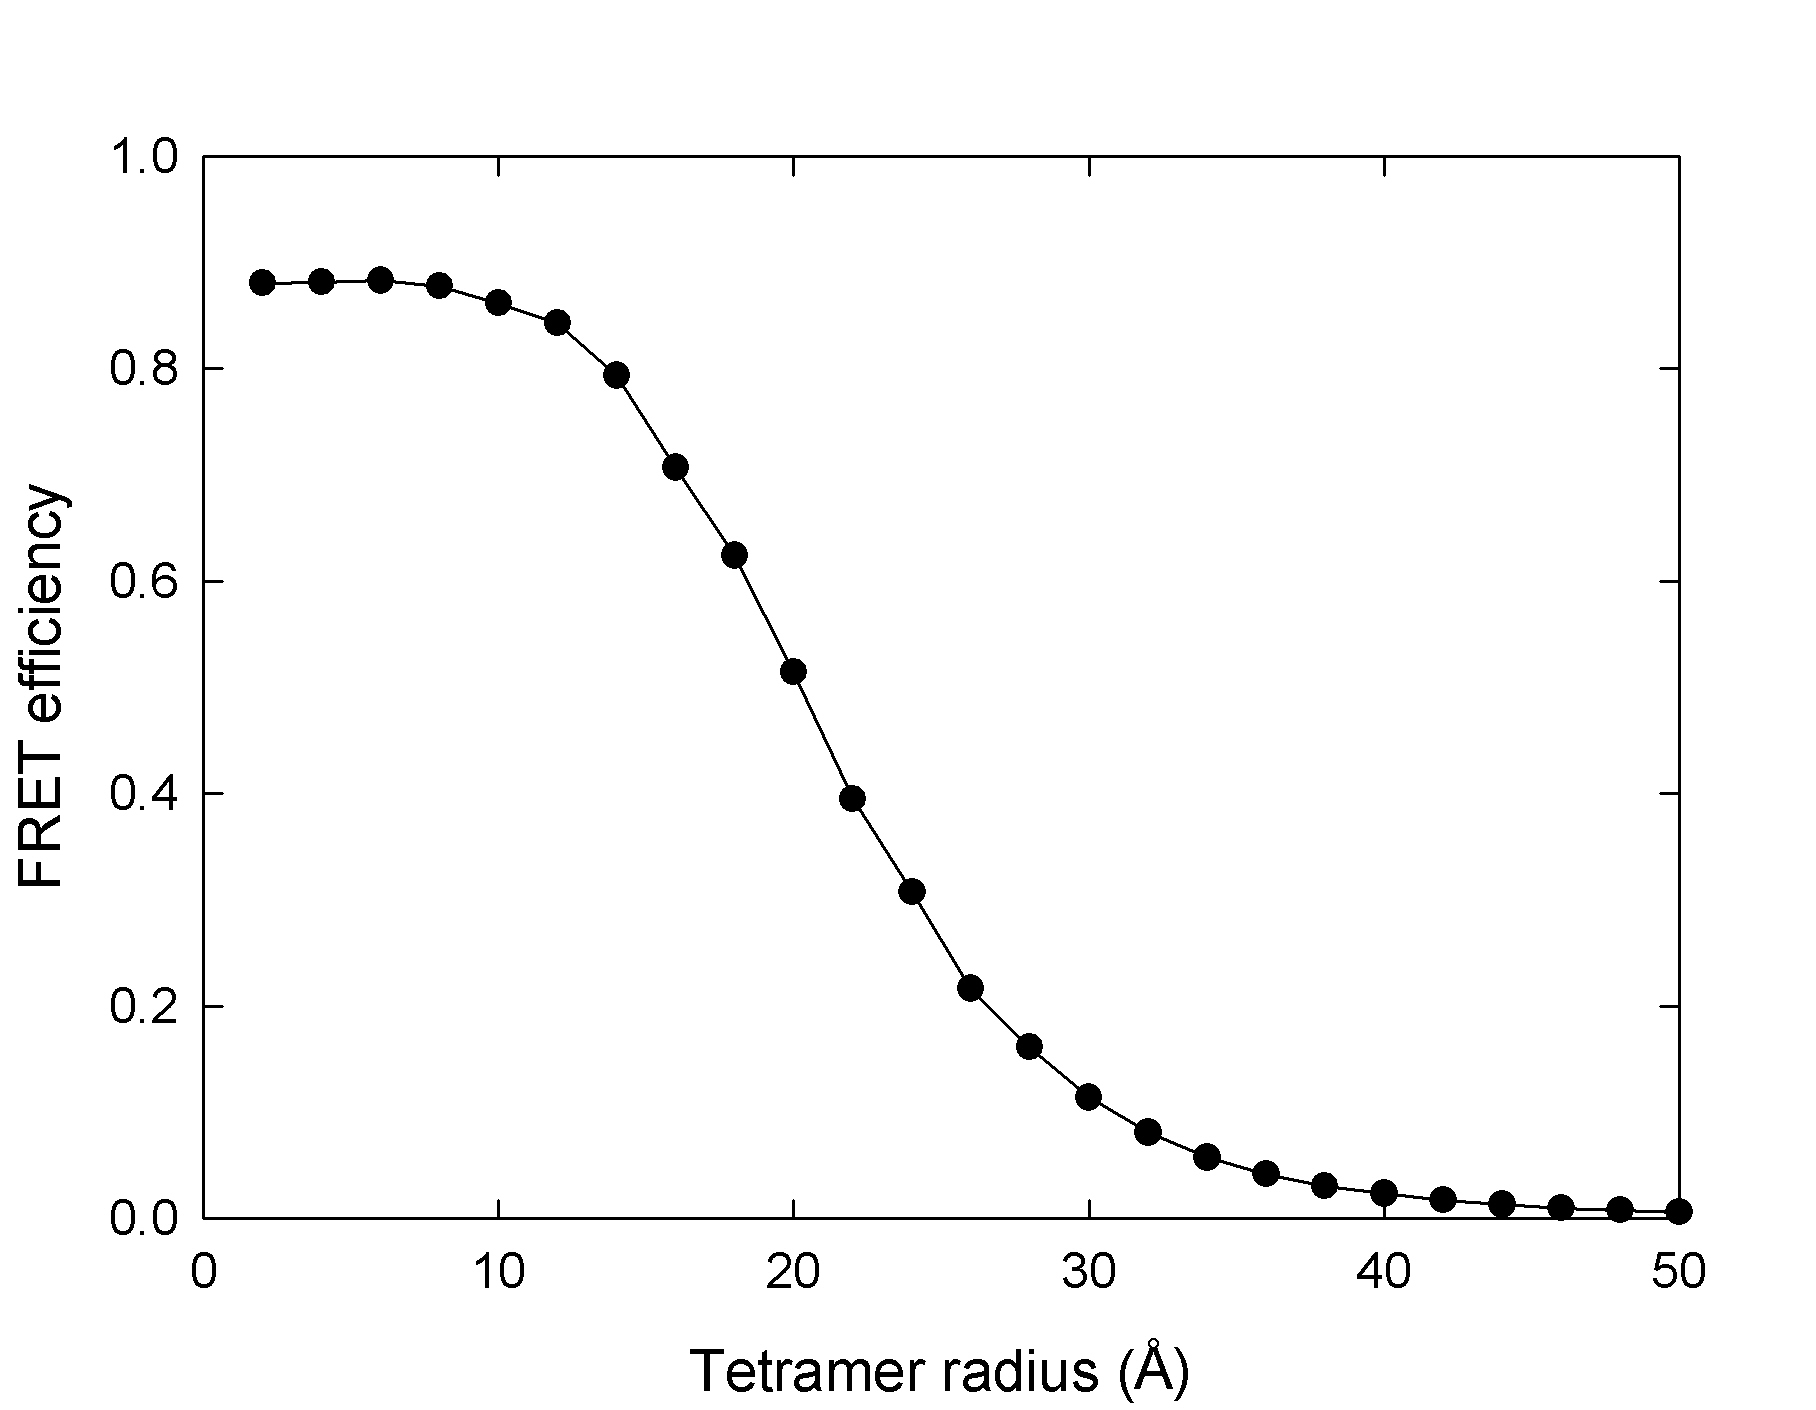
In a multimeric protein, FRET efficiency is not related to the size of the multimer through the R-6 relationship . Properly understanding the relationship between FRET efficiency and fluorophore separation can be essential to studying the structure of multimeric proteins or their conformational changes. The following plot is an example of how ExiFRET can be used to relate observed FRET efficiency to the multimer radius in a tetrameric protein (for example a membrane protein with 4 transmembrane subunits)
Labelling efficency
ExiFRET can also be used as tool to investigate the effect of labelling efficiency on the observed FRET efficiency. The following graph demonstrates how the inability to label every site on a host with a fluorophore reduces the expected FRET efficiency and hence changes the E vs R relationship.
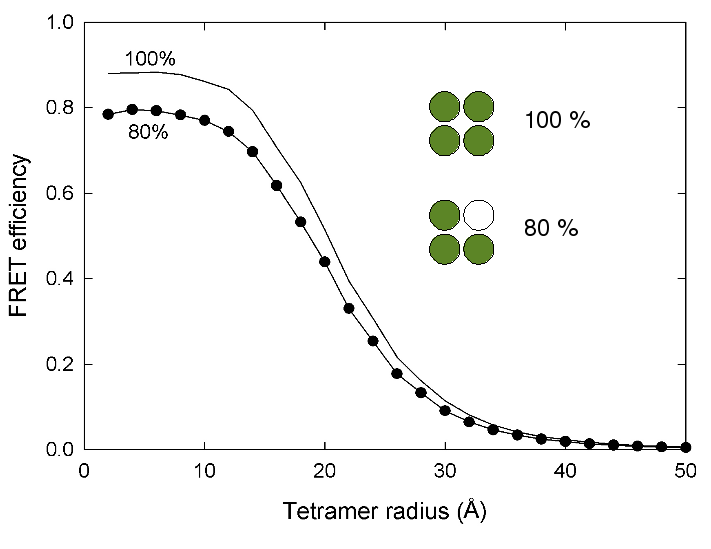
In order to produce a plot like the above, the program needs to be executed twice with the same input parameter expect the value of the labeling effiency. Example input files can be found in the follwoing links: 80% labelling efficiency 100% labelling efficiency