Examples
The follwoing are Figures from the newest ExiFRET publication including example input files. When referring to these figures or results please cite the ExiFRET paper .
Background concentration
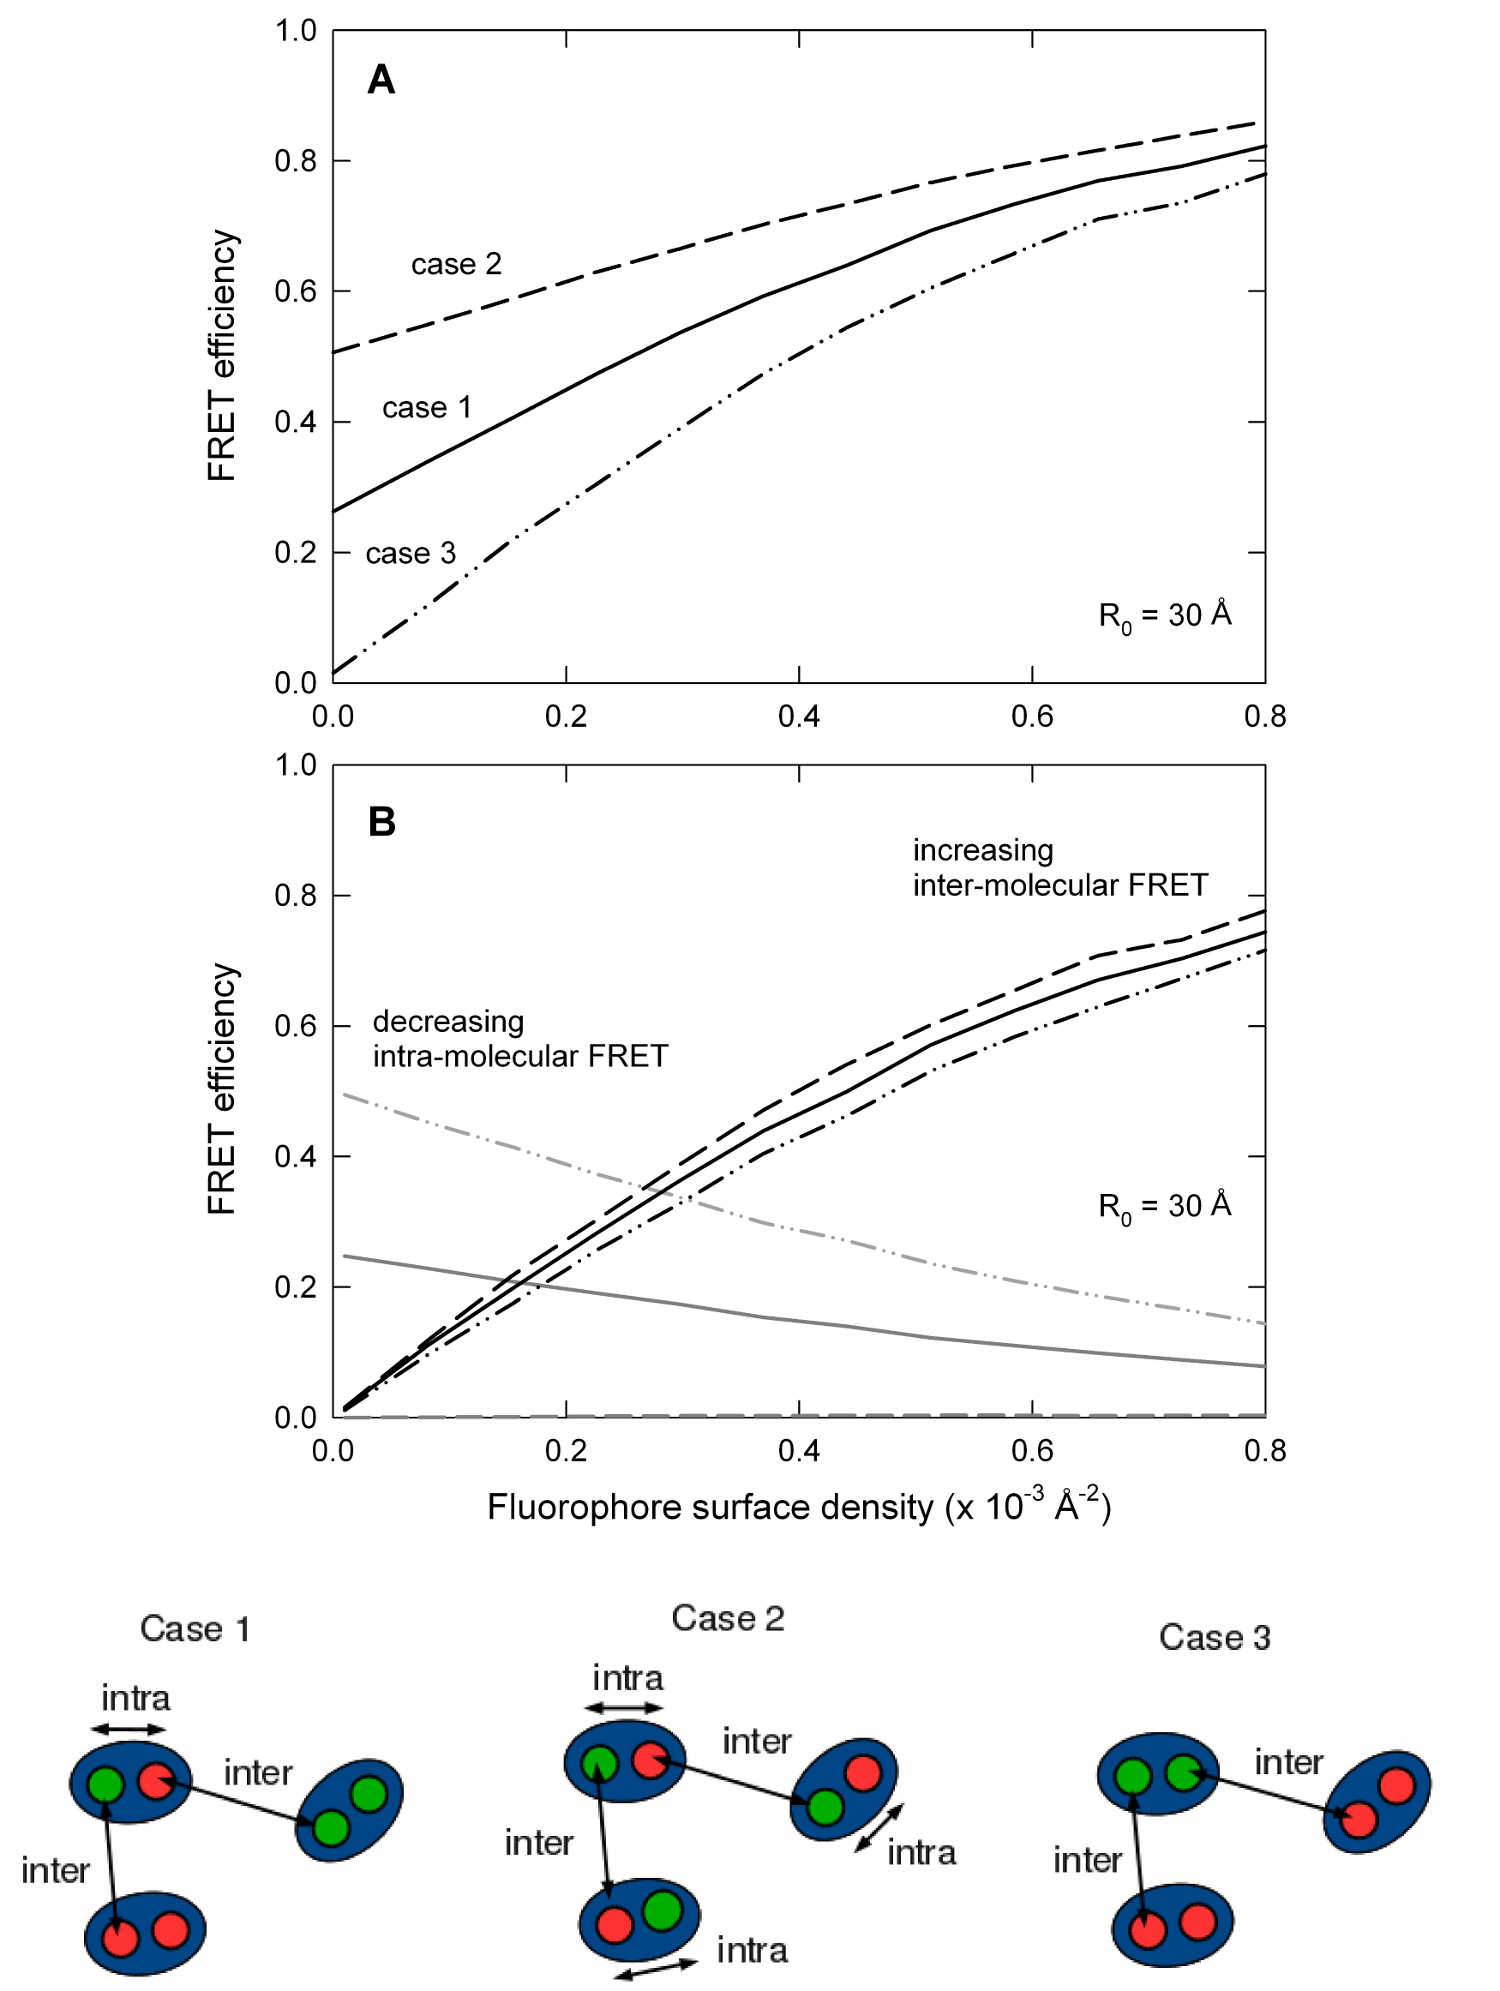
Protein crowding in a membrane can mean that FRET occurring between fluorophores attached to separate hosts can interfere with intra-molecular measurements aimed at understanding the structure of the host. The importance of such inter-molecular FRET can be distinguished from FRET occurring between fluorophores attached to the same host. These links contain sample input file to produce the data for plot A and B ( intra-molecular , intra-molecular )

Inter- and intra-molecular FRET
ExiFRET can also be used to quantify the contributions of inter- and intramolecular FRET to the total observed FRET efficiency by plotting FRET efficiency vs fluorophore density for 3 different labeling protocols. Case 1: every site has equal probability of being a donor or acceptor (solid lines). Case 2: each host has one donor and one acceptor (dashed lines). Case 3: each host has either 2 donors or 2 acceptors (dot-dot-dashed lines). Sample input file to produce the data for Case 1, Case 2 and Case 3.
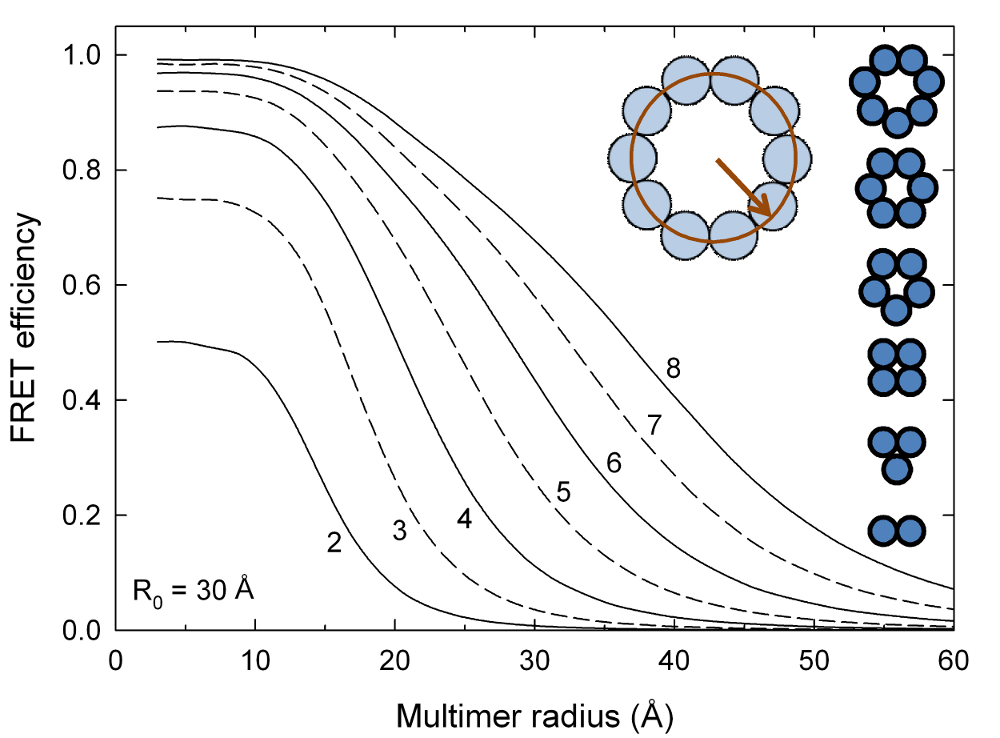
Size of multimeric proteins
In a multimeric protein, FRET efficiency is not related to the size of the multimer through the commonly used 1/r6 relationship. Properly understanding this relationship can be essential for studying multimeric proteins such as ion channels. A sample input file to produce the data for the following plot can be found here
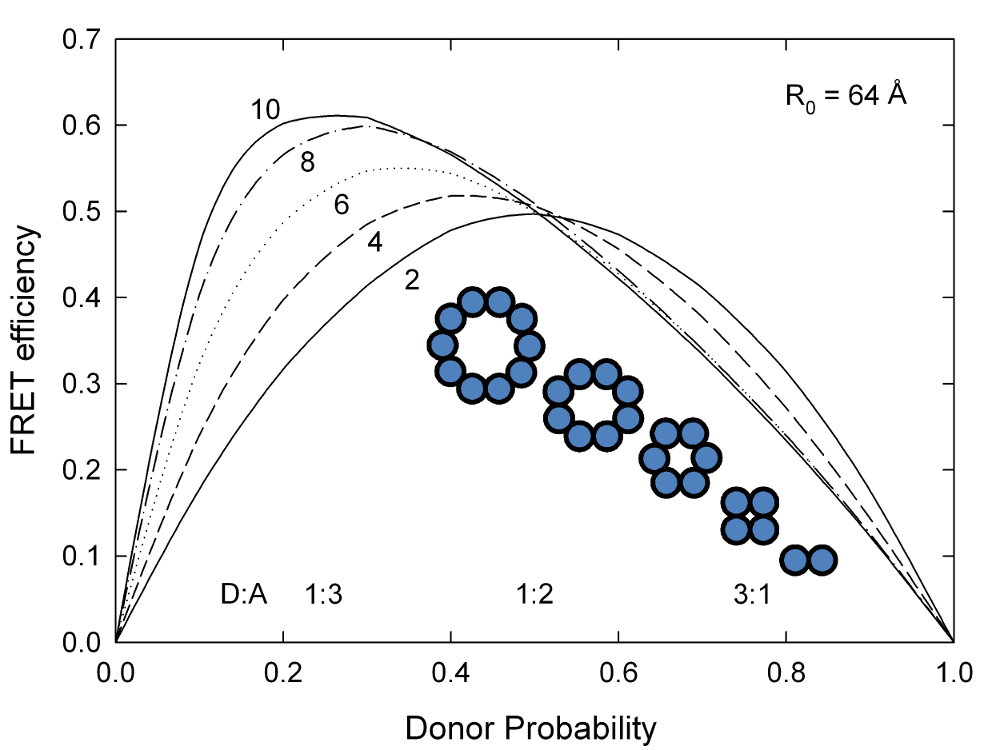
Oligomers
ExiFRET can also be useful to differentiate between dimers, trimers or larger oligomers by determining the number of subunits in the oligomer. A plot of FRET efficiency vs donor probability (ie donor:acceptor ratio) for a series of ring-shaped oligomers with increasing numbers of subunits shows a systematic shift of maximum FRET efficiency with increasing number of subunits. A sample input file to produce the data for the following plot can be found here
Stoichiometry of subunits
ExiFRET might also be useful to investigate the effect of the different stoichiometries of subunits in multimeric proteins. A sample input file to produce the data for the following plot can be found here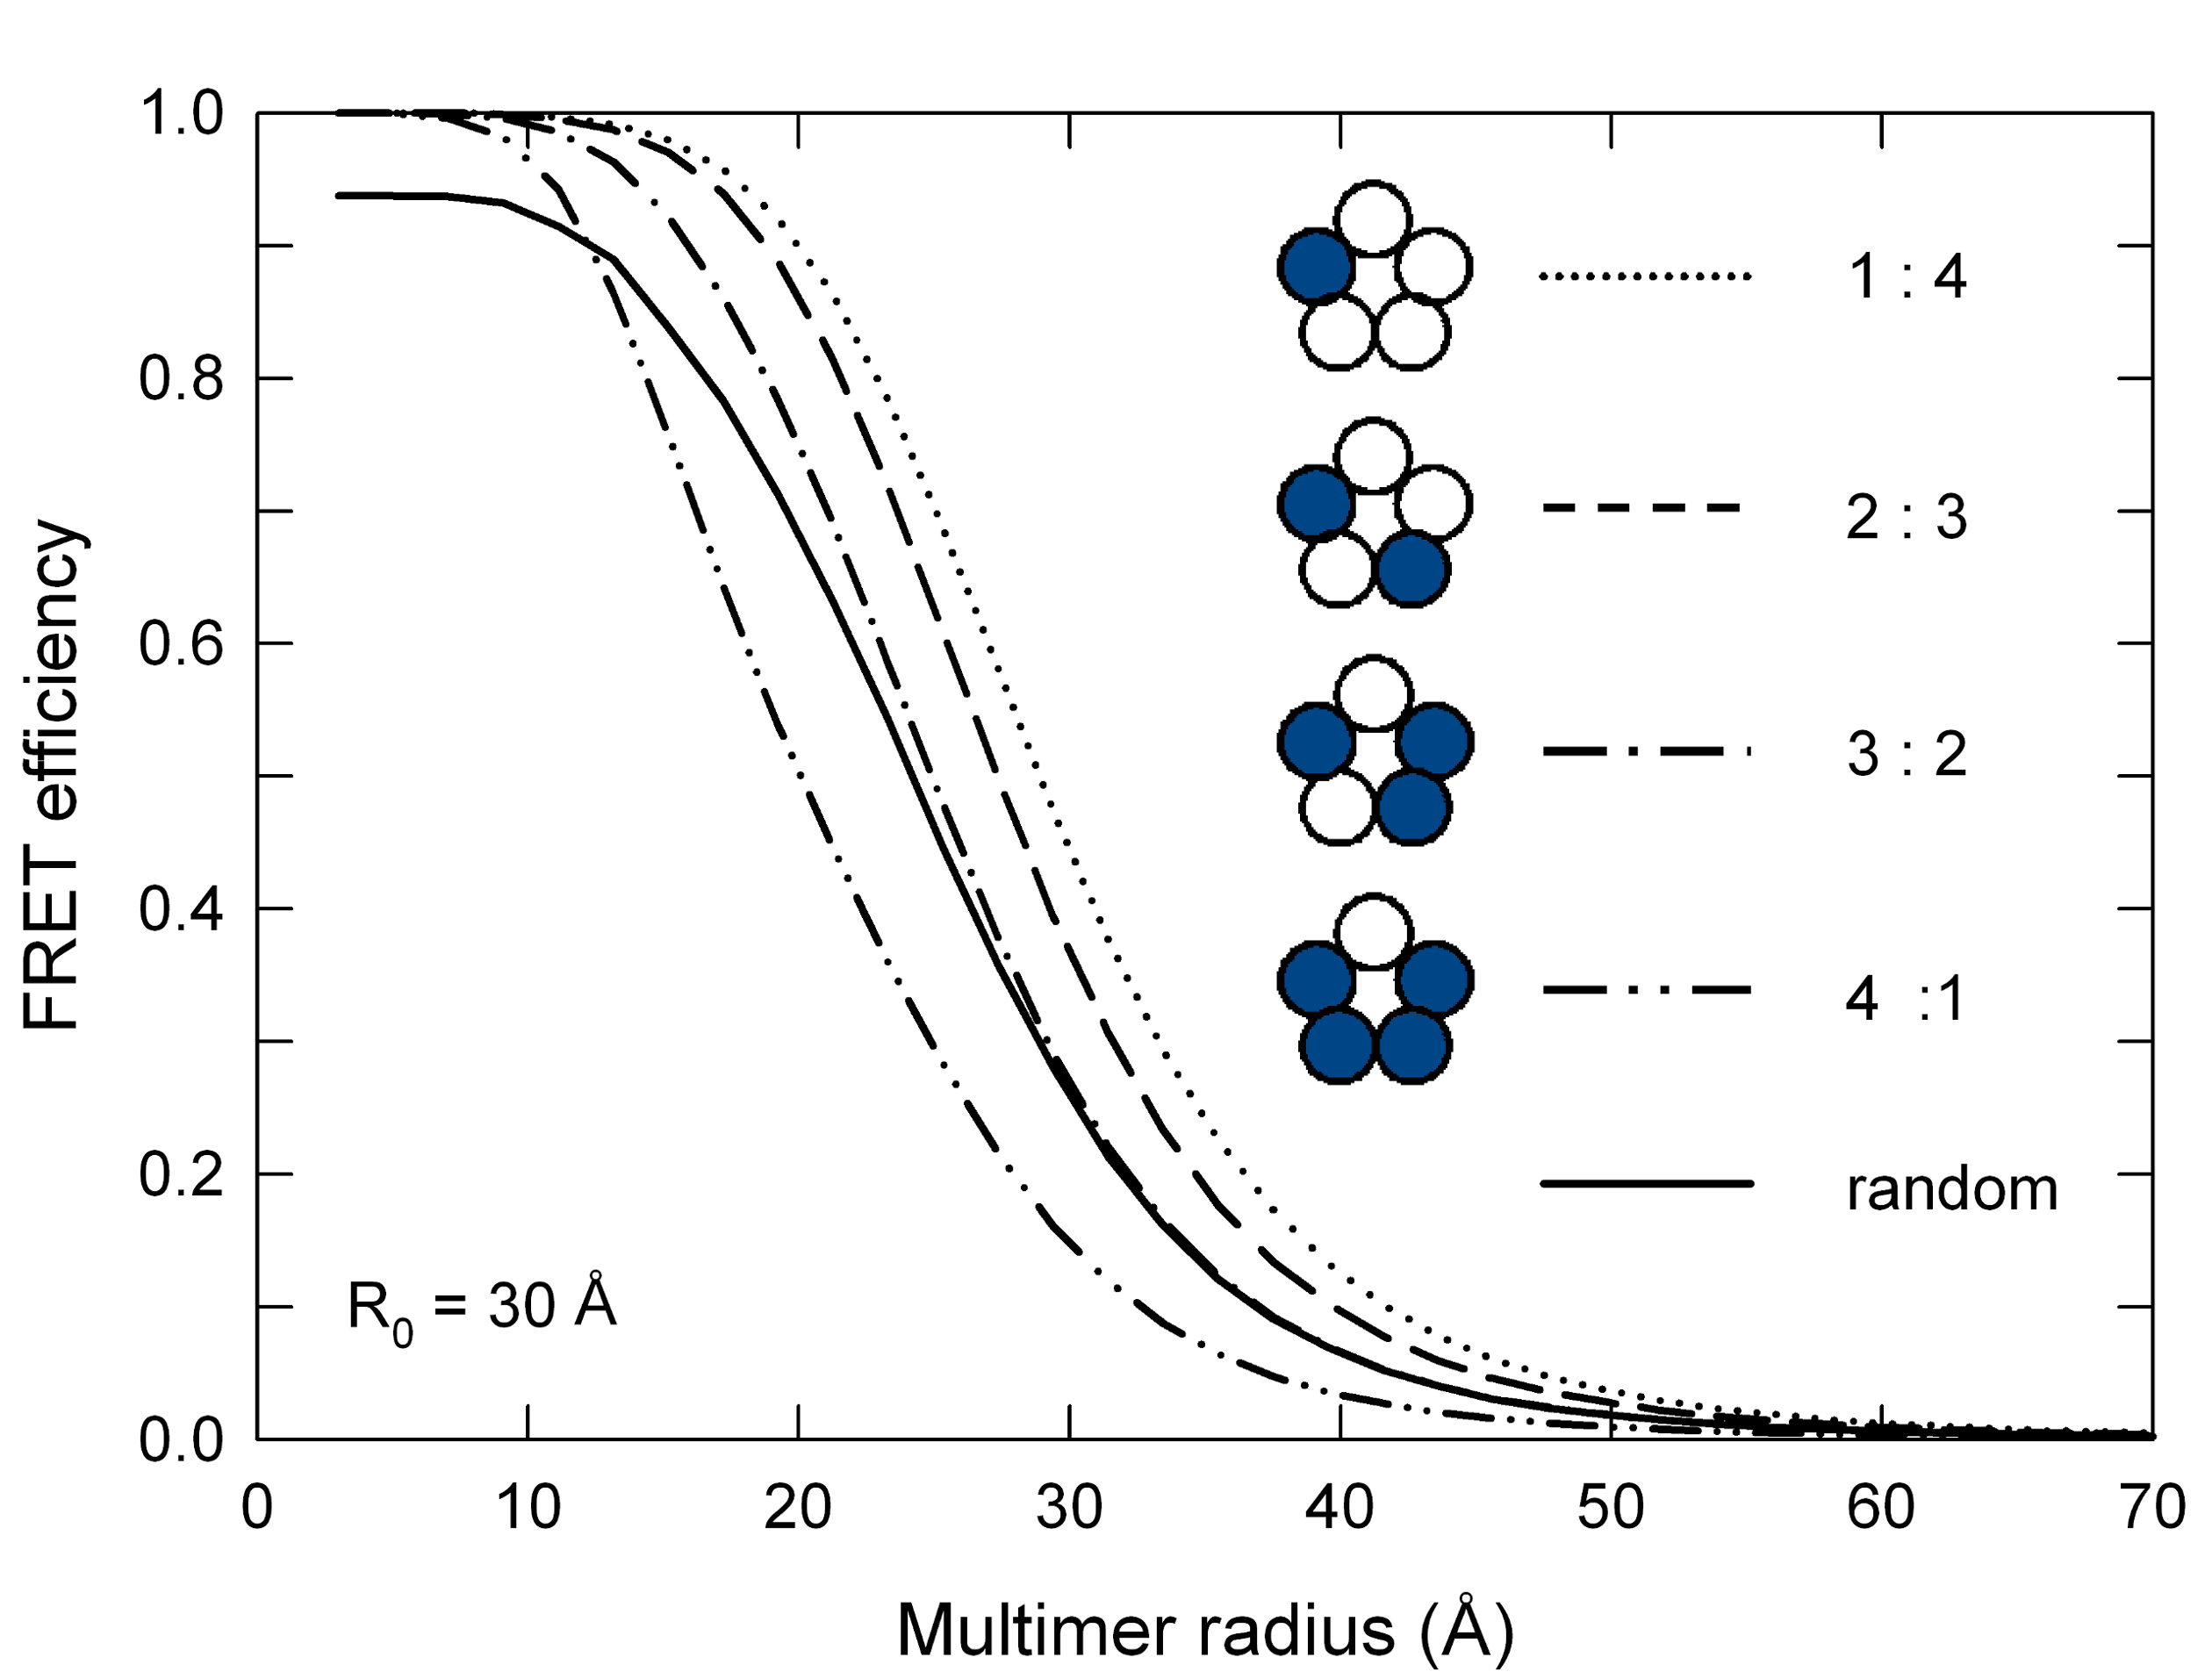
Radius of fluorescent probe
When using FRET to determine the radius of a multimeric protein it might be necessary to consider the size of the fluorescent probe relative to the size of the host molecule. The observed FRET efficiency is based on the fluorophore positions which are not necessarily equal to the positions of the host subunits to which the probes are attached. If the size of the fluorescent probe is small relative to the size of the host, this difference in positions might not be important. However, with large fluorescent probes or long linkers significant differences can arise. Deviations can be as large as 10%. A sample input file to produce the data for the following plot can be found here

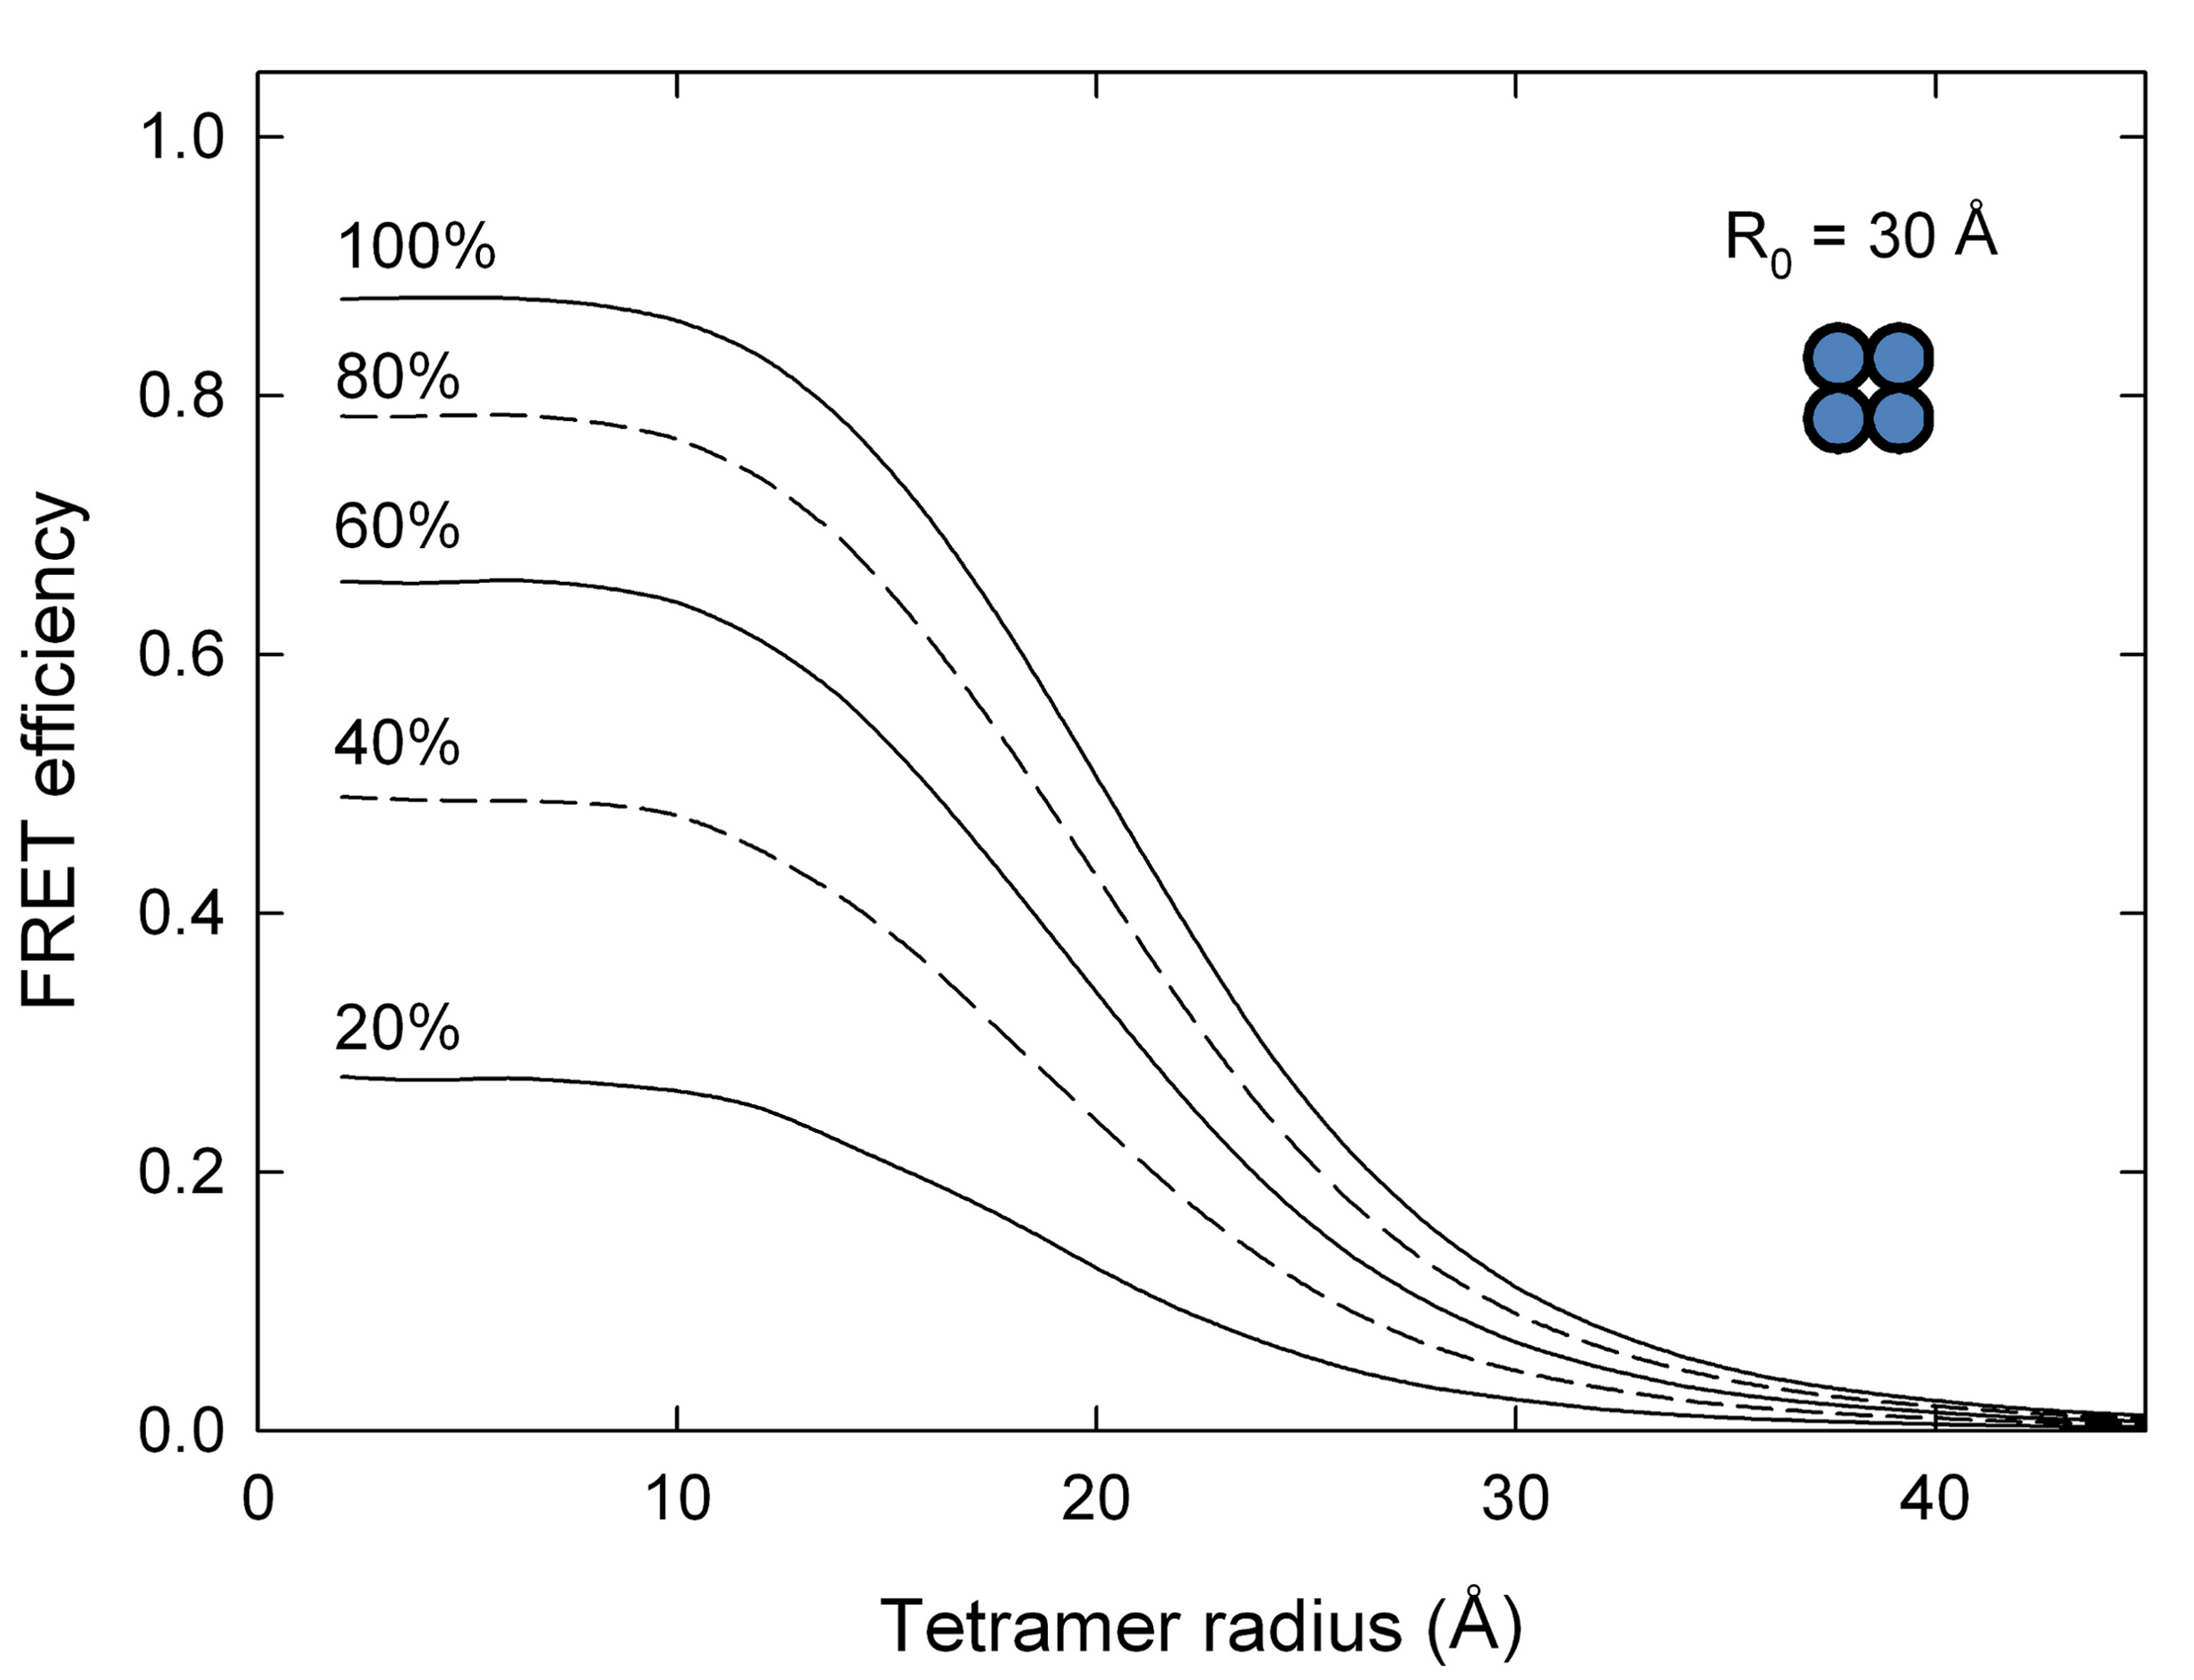
Labelling efficiency
The inability to label every site on a host with a fluorophore reduces the expected FRET efficiency resulting in uncertainty if the data is used fro quantitative analysis. ExiFRET can be used to quantify the effect of reduced labeling efficiency on FRET efficiency. A sample input file to produce the data for the following plot can be found here
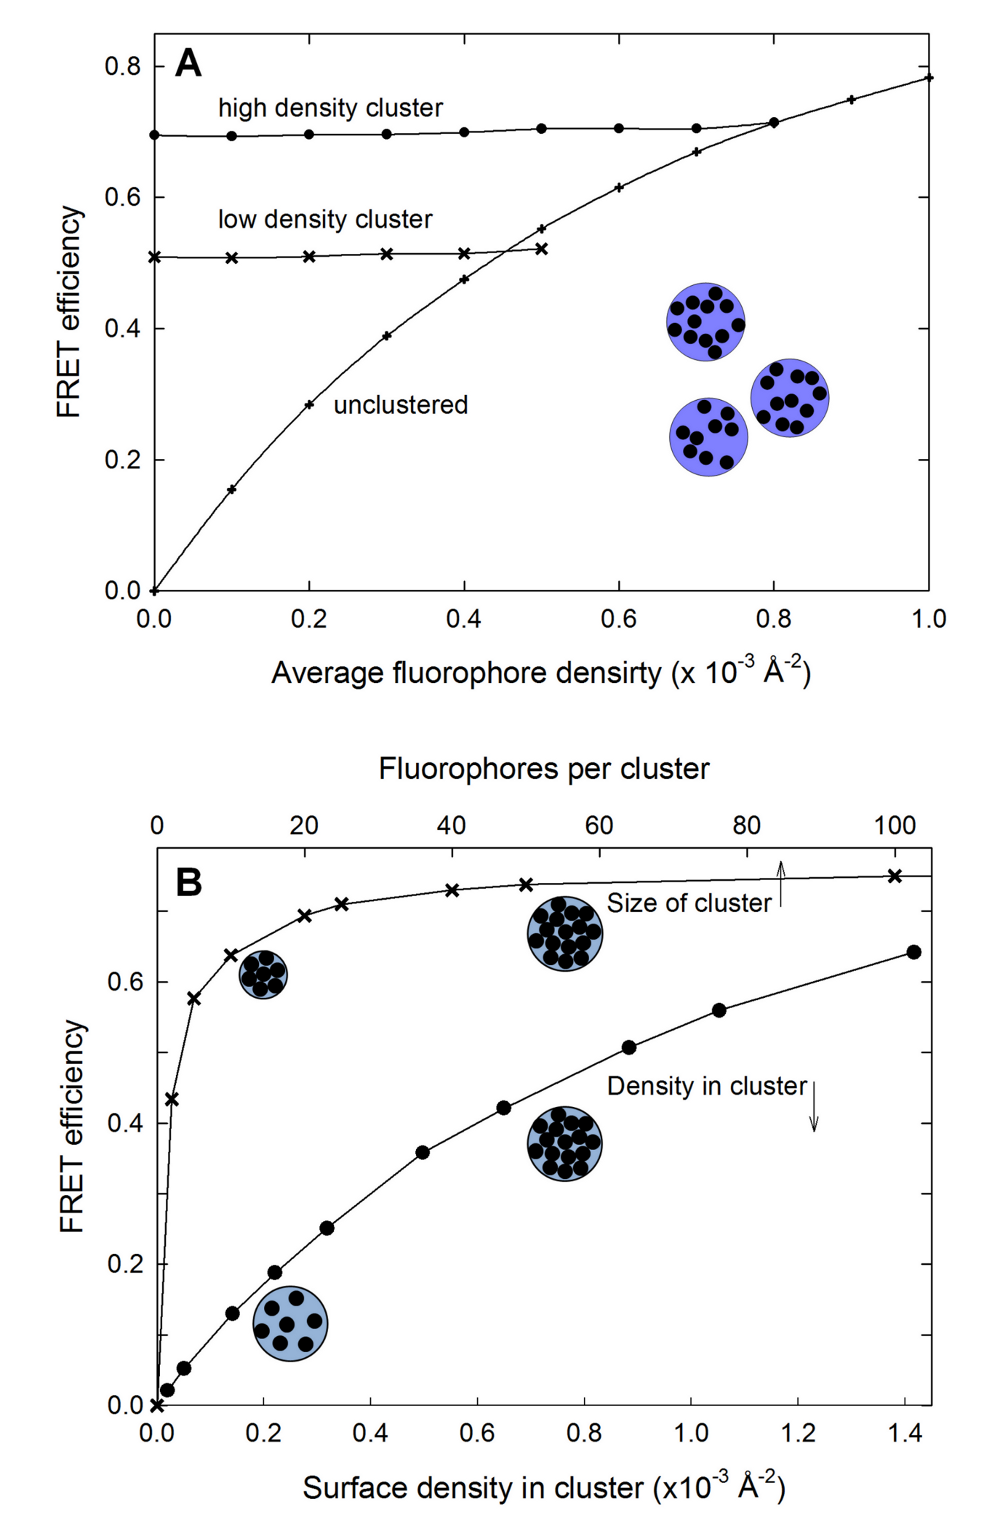
Clusters of fluorophores
Clustering within a membrane can be detected by the lack of change of FRET efficiency with increasing surface density. The clusters are modeled as local regions with high density. The clusters themselves as well as the fluorophores inside the cluster are randomly distributed.
These links contain sample input file to produce the data for plot A (clustered) , A (unclustered) and B .